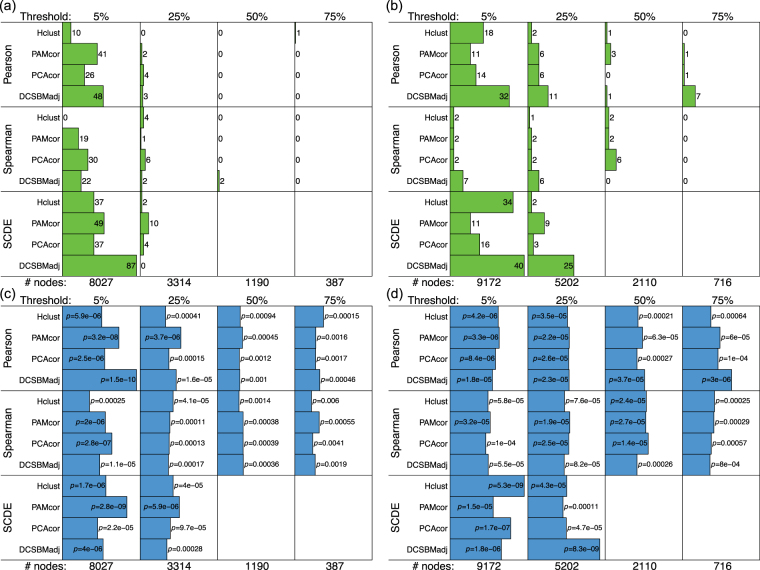
Figure 2.
Performance of the methods: micro-RNA targets. (a and b) show the total number of significant overlaps (FDR ) and (c and d) show the most significant overlap (), between detected subnetworks and the ‘micro RNA target’ gene-sets, for neuron and oRG respectively. The robustness thresholds are shown above each panel (i.e., the minimum percentage of cells in which a gene must be non-zero for it to be included in the network), with corresponding numbers of network nodes below.

