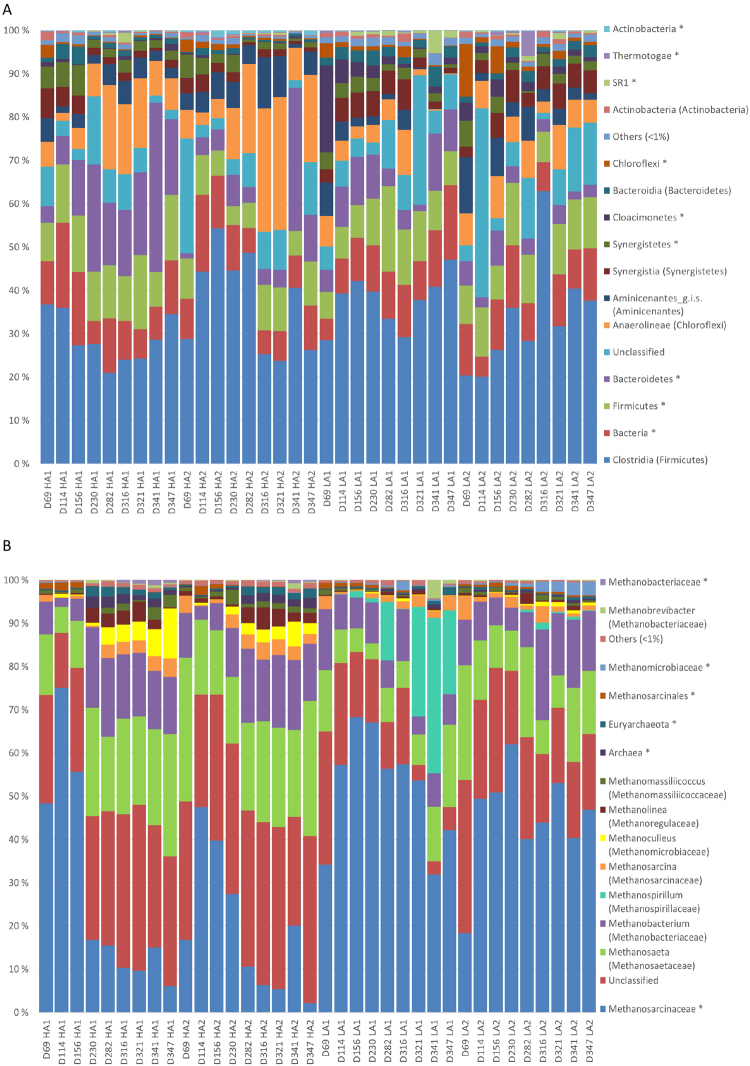
Figure 3.
Relative abundances of bacterial classes (A) and archaeal genera (B) represented in the v3–4 16S rDNA amplicons obtained for individual reactor samples. Each bar represents one sample, and is labelled as follows: D indicates the experimental day; HA1 and HA2 refer to the two reactors operated at 3.7 ± 0.2 g NH4-N L−1, and LA1, and LA2 refers to the reactors operated at 1.9 ± 0.2 g NH4-N L−1. OTUs that could not be classified at the domain level are labeled “Unclassified”, while OTUs that could not be classified at class or genus level for bacteria and archaea, respectively, are labeled *. Only taxa represented by a portion of ≥1% of the sequence reads in at least one of the samples are shown. “Others” include all reads representing the taxa with <1% abundance in all samples.

