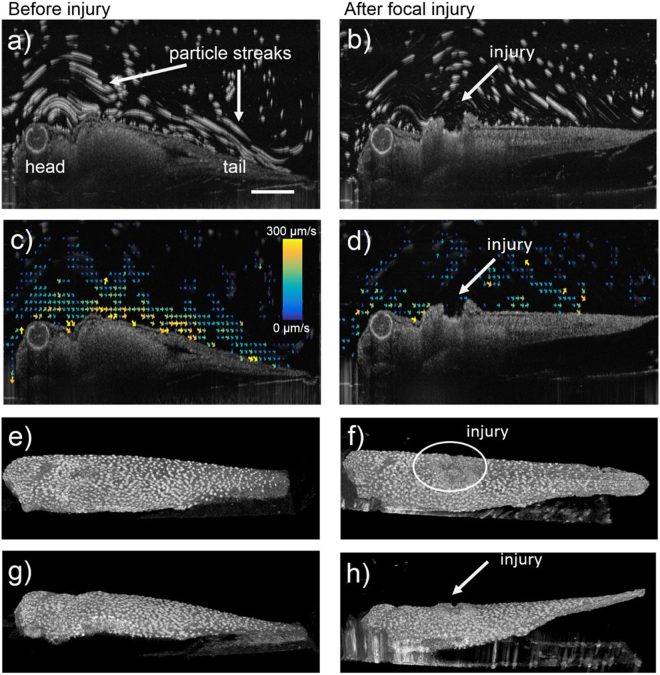
Figure 2.
Imaging of ciliated Xenopus embryo skin before (a,c,e,g) and after focal injury (b,d,f,h). (a,b) Maximum intensity projection of a 100-frame video allows the visualization of tracer particles as particle streaks. The injury is visible as indentation in the embryos surface (marked with an arrow in b). (c,d) Vector flow field quantification of cilia-driven flow. The vector flow field is disrupted around location of injury (panel d). (e–h) 3D rendered speckle variance images visualize beating ciliary patches on embryo surface (panels e and f- view from top; panels g and h- view from side). The injury is visible as area with low speckle variance (white circle) in panel f and as indentation in panel h. The scale bar in panel a measures 0.5 mm.

