
Fig. 1.
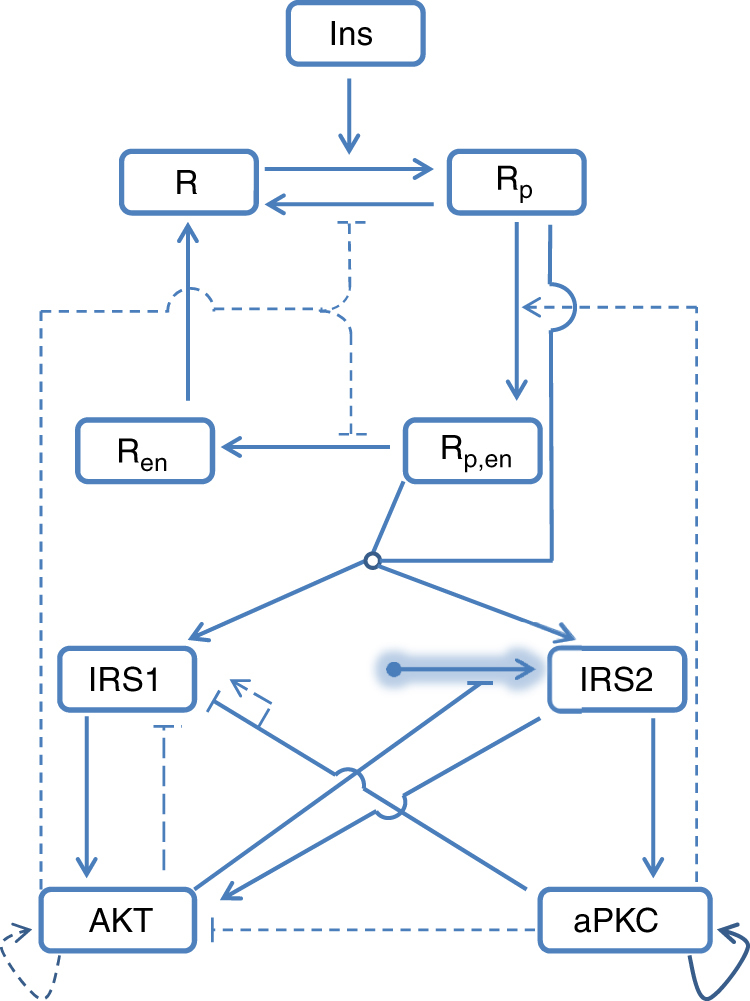
Scheme of the mathematical model. Insulin (Ins) induces insulin receptor (R) phosphorylation (Rp), which then undergoes internalization (Rp,en), dephosphorylation (Ren) and reinsertion into cell membrane (R). Phosphorylated insulin receptors (both Rp and Rp,en) activate IRS1 and IRS2, which both activate Akt. Only IRS2 activates aPKC. Synthesis of IRS2 (shadowed arrow with round end) is subject to inhibition induced by AKT. Both, AKT and aPKC have positive auto-feedback. aPKC inhibits IRS1 and AKT activity. Broken lines indicate feedbacks that have been suggested in the literature but are dispensable for data fitting. Shadowed arrows with round ends indicate that the synthesis and degradation of the pointed element are considered in the model. The open circle at the place of merging lines indicates shared downstream targets