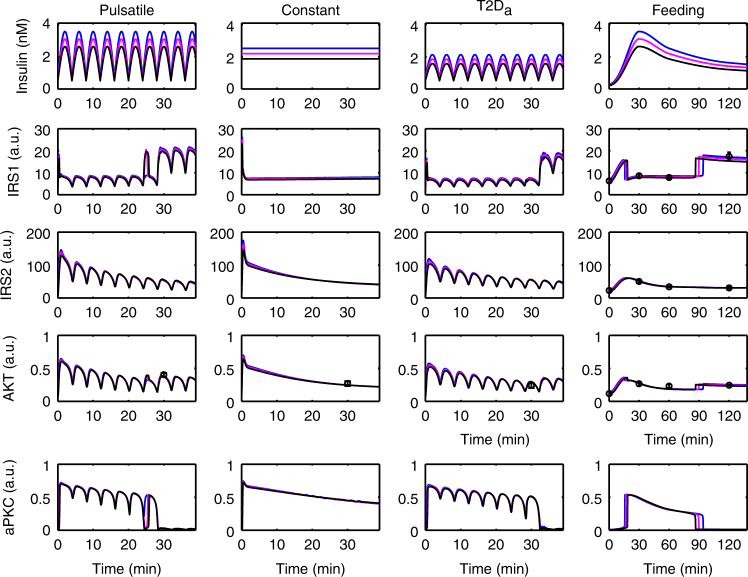
Fig. 4.
Response of the model to three doses of insulin. The activities of the signaling molecules are plotted with arbitrary unit (a.u.). Each column corresponds to one specific experimental set-up (see text). The best fit in Fig. 2 is shown in magenta which defines a reference amount of insulin. Using 85 and 115% of this insulin is shown in black and blue, respectively. The timing of aPKC switch-off and IRS1-AKT rebound is sensitive to the insulin level, while the activation level is not. See Supplementary Fig. 4 for similar results based on other parameter sets

