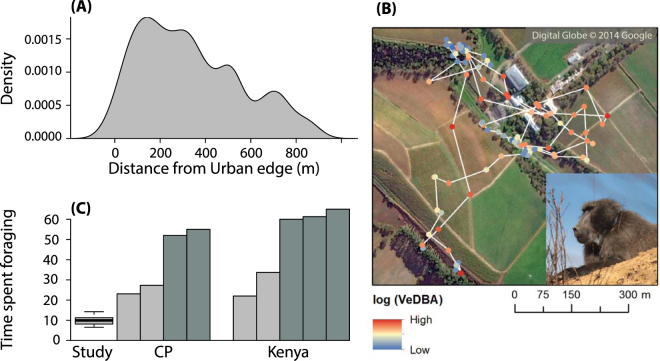
Figure 4.
Raiding baboons’ sit-and-wait strategy and its consequence for foraging time budgets. (A) Baboon’s space use for collared males (n = 6) as the density of GPS locations found at a given distance from the urban edge. (B) An example of a GPS track for a baboon (inset, wearing collar) moving in and out of the urban habitat in a vineyard. GPS points represent 5-minute intervals from 7:30 to 18:00 (n = 113), with the colour of the points representing the mean VeDBA (the Vectorial Dynamic Body Acceleration) in log scale, from blue for low level of activity (minimum 0.01 g) to red for high level of activities (maximum 0.38 g), 30 seconds before and after the GPS location. White lines link GPS fixes for illustration. The map was created using ArcScene 10.4.1 (http://desktop.arcgis.com) (C) Time budget data for collared males in (n = 6), in comparison to other populations. Raiding populations are shown in light grey and non-raiding populations are in dark grey. Data for the Cape Peninsula (CP) from Hoffman23 (recorded in 2006 in winter) and data from Kenya from Altmann and Muruthi32 (recorded between 1984 and 1985 in dry season) and Strum19 (recorded between 1981 and 1984 in both dry and wet seasons).

