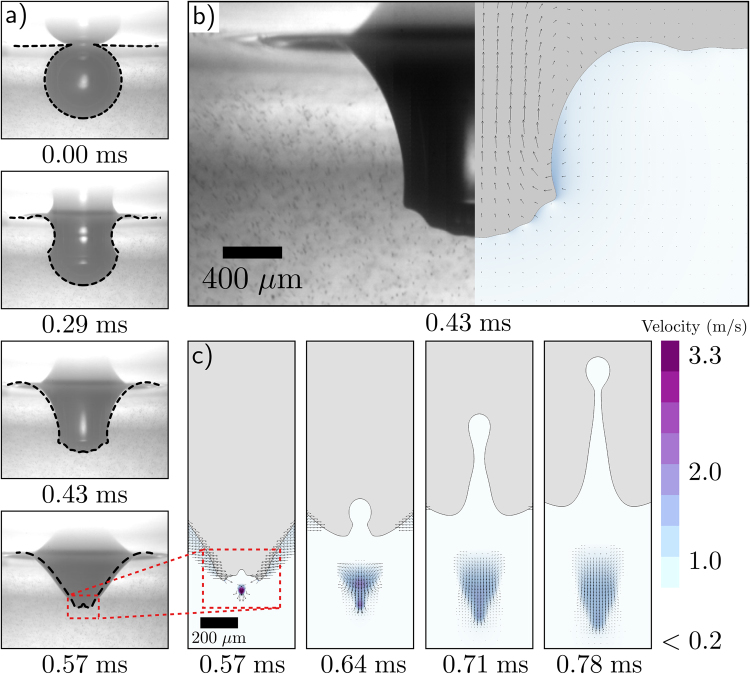
Figure 2.
A direct comparison between our high-speed bubble bursting experiment and the corresponding simulation. (a) The interface predicted by the simulations is overlayed (black dashed line) onto the experimental profile from Fig. 1a. (b) A side-by-side comparison demonstrates that the fine features of the capillary waves immediately before colliding at the bottom of the bubble are well defined in the simulation result. (c) Upward and downward traveling jets are formed immediately after the capillary waves collide and focus the flow. Here the magnitude of the downward velocity is plotted.

