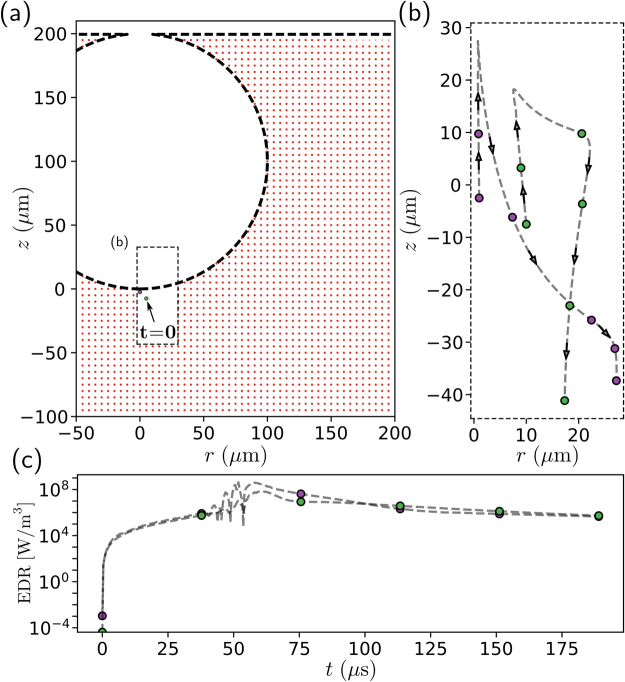
Figure 4.
Overview of numerical tracking method. (a) At t = 0, the liquid phase of the simulation is seeded with a grid of numerical particles. (b) As the simulation progresses the position of each particle is tracked. As an example, we plot the trajectory of two particles that are initially pulled upwards before being propelled downwards in the liquid jet shown earlier in Fig. 2c. (c) Along with the position of each particle, the EDR experienced at each point is also recorded. We see that the particles experience EDR values ranging over several orders of magnitude.

