
Figure 2.
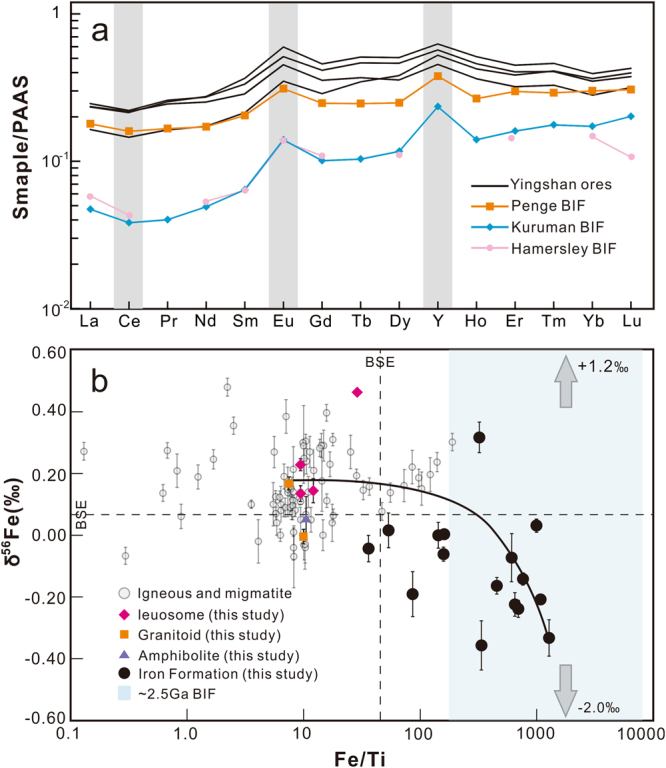
Plots of rare earth element plus yttrium (REE + Y) patterns (a), and δ56Fe (‰ relative to IRMM-014) versus Fe/Ti ratios (b) for samples from the Yingshan iron deposit. For comparison, the REE + Y patterns of ~2.5 Ga Hamersley, Penge and Kuruman BIF are also plotted in Fig. 2a. Data of igneous rocks (Supplementary Table S2) and banded iron formations (Supplementary Table S3) are plotted as light gray dots and light yellow shaded rectangles, respectively. The solid curve denotes the mixing trend between YS-01 (granitoid) and YS-43 (banded ore).