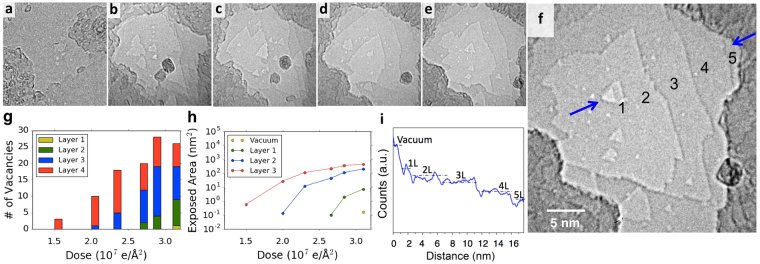
Figure 2.
Layer by layer stripping of multilayer h-BN. (a–f) TEM time series showing the formation of defects and stripping of layers at doses of (a) 0, (b) 2.0 × 10⁷ e/Å2, (c) 2.3 × 10⁷ e/Å2 (11 min), (d) 2.8 × 10⁷ e/Å2 (15 min), and (e) 3.1 × 10⁷ e/Å2 (18.5 min) under a 10–20 nm condensed electron beam with a current density of 37 A/cm2. After frame (e) the beam is expanded with a current density of 3 A/cm2 to produce the single nanopore shown in (f). In (f) the layer numbers are denoted. (g) The number of continuous vacancies present in each layer of the sample as a function of dose. (h) A graph depicting the amount of area exposed of a given layer or below, note that the area exposed of each layer or below goes asymptotically towards probe size. (i) Grayscale count profile along the path between the two arrows in (f). The difference between layer 1 and vacuum is larger than between other layers. The size in nanometers of frames (a–f) are constant.

