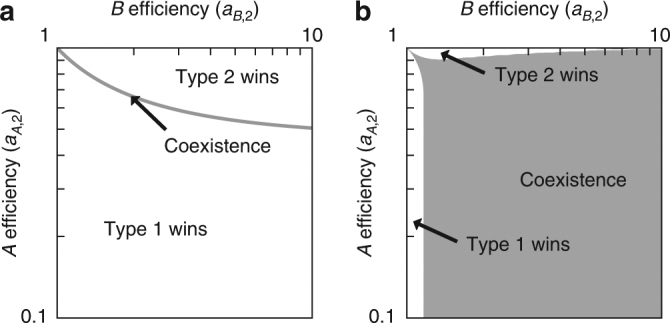
Fig. 1.

Coexistence with and without diffusion. a The growth rate of a population consisting of a single cell type is a function of the maximum amount of each essential metabolite that it can produce, i.e., a A for A and a B for B. The gray line is the locus where the growth rate of a cell (type 2) equals that of a reference cell (type 1) that has equal costs for producing either metabolite, with a A,1 = a B,1 = 1. In the absence of diffusion, coexistence with the reference cell type is only possible where the growth rates are equal. Above the gray line, the type 2 cell grows faster and drives the type 1 cells to zero relative frequency, i.e., the type 2 cells “win.” Below the line, the situation is reversed. The coexistence line represents a transition between the different cell types winning. b With diffusion, e.g., when D = 3, each cell-type population is affected by the other’s production. The coexistence region is significantly larger and fills much of the quadrant considered, corresponding to where each cell type is more efficient than the other at producing one of the metabolites
