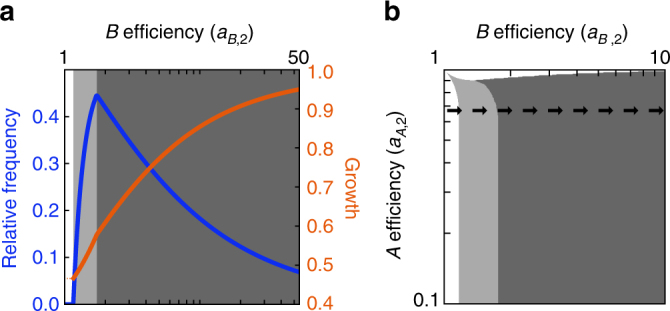
Fig. 3.

The curse of increased efficiency. a The relative frequency of type 2 cells (blue) and growth rate of the total population (orange) are shown as a function of the efficiency of type 2 cells in producing metabolite B. We fix a A,2 = 0.67. As the efficiency of type 2 cells increases, their relative frequency ultimately decreases. The population growth rate, however, increases with a higher metabolic efficiency. b The shaded regions indicate where type 2 cell populations are increasing (light gray) or decreasing (dark gray) in relative frequency as they improve in efficiency in producing metabolite B, that is, moving from left to right along the indicated line. In the dark-gray region, the relative frequency of cell type 2 decreases toward 0 as its efficiency increases toward infinity
