
Fig. 4.
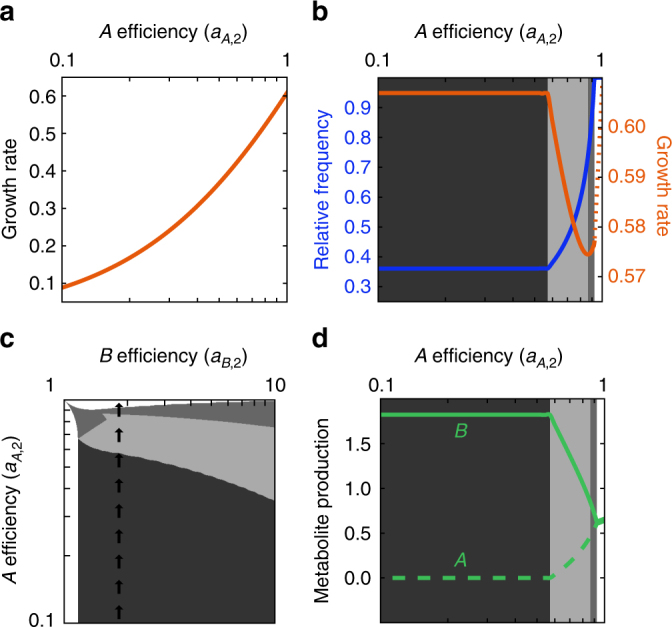
The curse of decreased inefficiency. a The growth rate of type 2 cells in isolation increases as they improve in efficiency of making A, the metabolite that they produce more poorly (a B,2 = 1.82, a A,2 < 1). b Similar to the previous plot, but in the presence of a reference cell type (a B,1 = a A,1 = 1). Here, as the type 2 cells increase in efficiency of producing A, the population growth rate (orange) decreases in the light-gray region. This also corresponds to an increase in relative frequency of the type 2 cell (blue). c The shaded regions indicate where the population growth rate is constant (dark gray), decreasing (light gray), or increasing (middle gray) as type 2 cells improve in efficiency in producing metabolite A, i.e., moving up along the indicated line. d The amount of B and A metabolites produced by type 2 cells is shown as a function of the efficiency in producing A. In the light-gray region, where the population growth rate decreases, the type 2 cells shift the production from the B metabolite to the A metabolite