
Fig. 5.
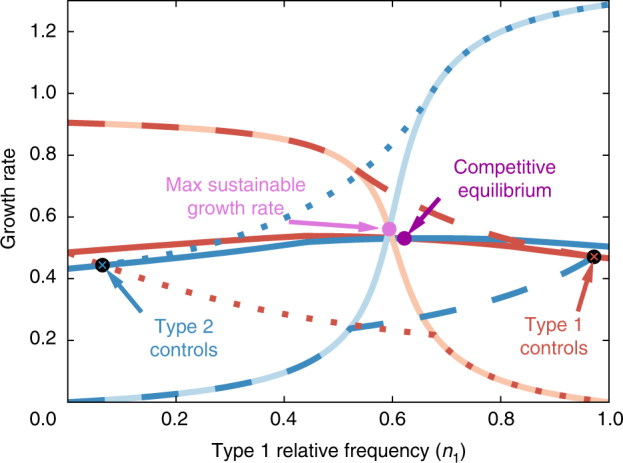
Different types of equilibria and the growth cost of control. The steady-state growth rate of cells of type 1 (red) and type 2 (blue) under four different scenarios: each type maximizing its own growth (dark solid lines), both types maximizing the growth of cells of type 1 (dashed), both types maximizing the growth of cells of type 2 (dotted), and perfect coordination, where each cell type produces only a single metabolite and the population achieves the maximum sustainable growth rate (light solid lines). The production efficiencies used in this example are a A,1 = a B,1 = 1, a A,2 = 0.67, and a B,2 = 1.49. The resulting population dynamic equilibria are marked. The growth rate of the competitive equilibrium is closer to the maximum sustainable growth rate than either equilibria reached when a single cell type is in control