Fig. 6.
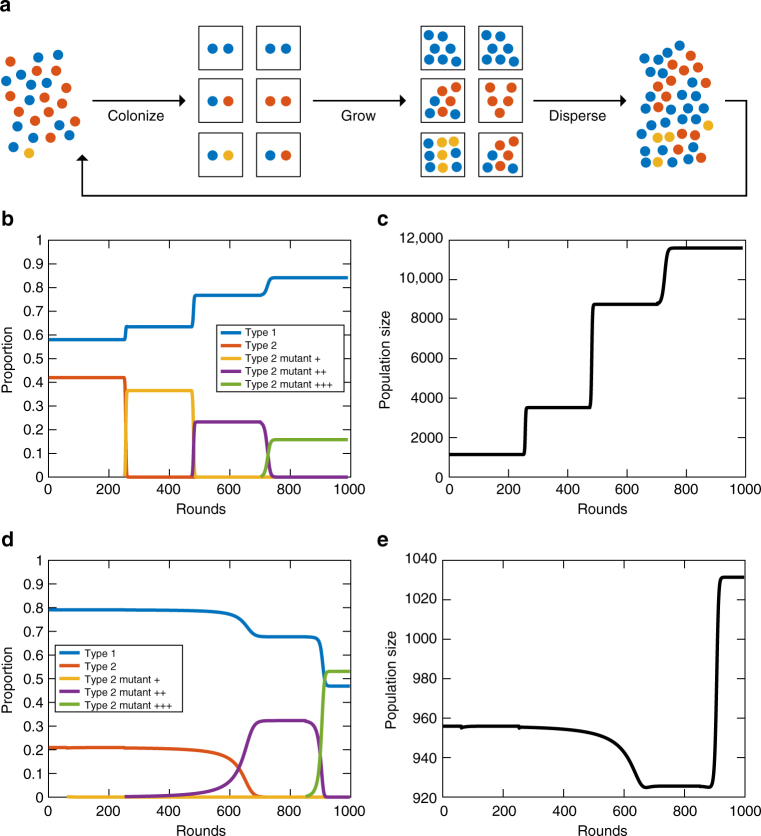
Evolution of paradoxical behavior in a metapopulation model. a A schematic shows the structure of the metapopulation model. Each patch (box) is colonized by two cells that are potentially of the same type. The cells grow and reproduce in the patch for a fixed amount of time and then, they are released to colonize new patches, thereby completing a “round”. The process is repeated until a steady state of relative frequencies is reached. b Paradox 1 is observed when cell type 2 mutants with increased a B,2 invade. Each + indicates a mutant with an increased efficiency over its ancestors such that the +++ mutant has the highest a B,2. In each case, the mutant successfully displaces its ancestor but reaches a lower final proportion. c The population size corresponding to b shows that despite the lower proportion of the mutant, the growth rate (proportional to population size) is increasing. d An invasion by type 2 cell mutants with successively higher a A,2 is shown. The first mutant does not invade, but the second and third do. e The population size corresponding to d shows the occurrence of paradox 2 during the invasion of the ++ mutant. The population size decreases. Following the successful invasion of the +++ mutant, the population size increases beyond its initial starting point

