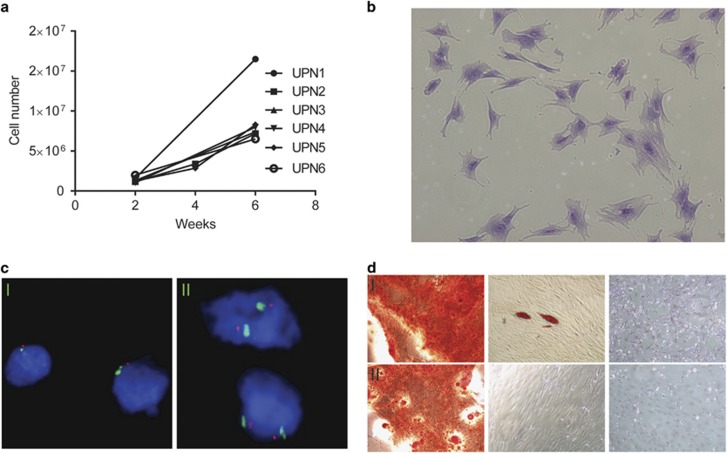
Figure 1.
BMS growth and characterization. (a) BMS growth curves. (b) Crystal violet stain of stroma cell cultures (UPN2). (c) Fluorescence in situ hybridization (FISH) analysis of chromosome 7. Bone marrow cells from acute myeloid leukemia (AML) patients with monosomy 7 showing AML blasts (I) and cultured stroma cells (II). Probe against 7q31 show one red signal in AML cells and two signals in BMS cells. (d) Differentiation of BMS cells, left panels show osteogenic differentiation stained with alizarin red. Middle panels show adipogenic differentiation stained with Oil red O. Right panels show undifferentiated cells as negative controls. Both samples are from AML patients diagnosed with monosomy 7, BMS cells were in culture for 2 weeks (UPN5) top raw (I) or ten weeks (UPN2) bottom raw (II) prior to differentiation assay.

