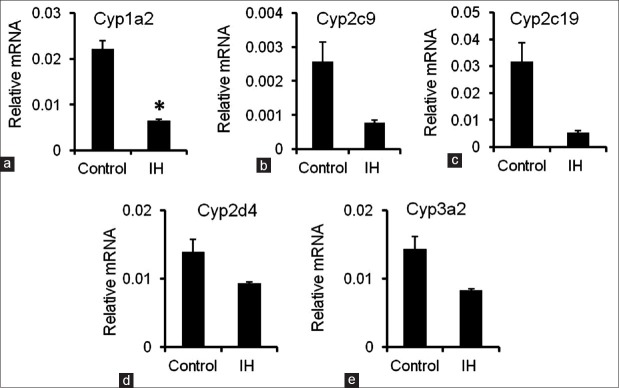
Figure 2.
mRNA expression levels of CYPs in the liver. (a-e) The mRNA expression levels of Cyp1a2, Cyp2c9, Cyp2c19, Cyp2d4, and Cyp3a2 were measured by quantitative reverse transcription polymerase chain reaction. Gapdh was used as the housekeeping gene. The data are presented as the mean ± standard error. *P < 0.05, compared with the control group. IH: Intermittent hypoxia; mRNA: messenger RNA; CYPs: Cytochrome P450.

