Figure 5.
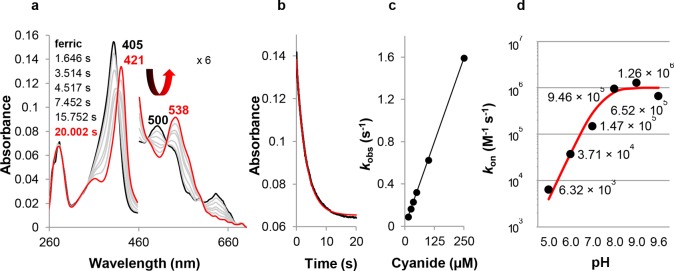
Binding of cyanide to ferric CCld. (a) Spectral changes during reaction of 1.5 μM ferric CCld (black spectrum) with 35 μM cyanide at pH 5.0. The red spectrum shows the emerging LS complex. The 460–700 nm region is magnified 6-fold. (b) Typical time trace at 405 nm. The single exponential fit of the curve is depicted in red. (c) Plot of kobs versus cyanide concentration. The apparent association constant kon was obtained from the slope of the regression line. (d) Apparent bimolecular rate constants of cyanide binding to ferric CCld at pH 5.0, 6.0, 7.0, 8.0, 9.0, and 9.6 determined by UV–vis stopped-flow spectroscopy. Plot of kon versus pH. The fit of the curve is depicted in red.

