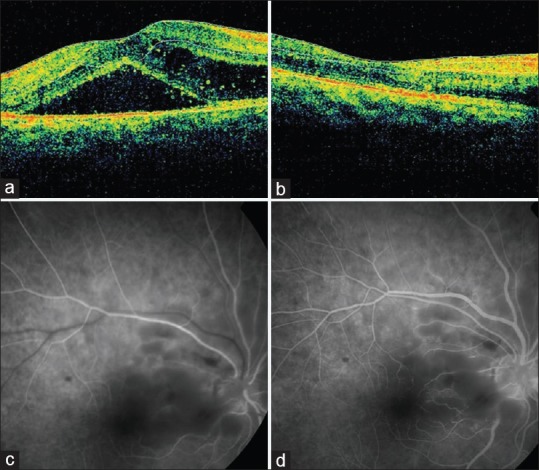
Figure 2.

Spectral domain optical coherence tomography and fundus fluorescein angiography. (a) Spectral domain optical coherence tomography showing subfoveal fluid and cystoid spaces. (b) Spectral domain optical coherence tomography after 1 week of oral doxycycline. Resolution of macular edema, but nasal fovea shows hyperreflective inner layers corresponding to retinitis patches. (c) Fundus fluorescein angiography corresponding to Fig. 1b – hypofluorescence corresponding to retinitis patches (Early frames). Small blotches of blocked fluorescence owing to superficial hemorrhages. (d) Late frames of fundus fluorescein angiography showing mild capillary leakage at the edge of the hypofluorescent patches and mild vessel wall staining at the disc margin, inferiorly
