Figure 6.
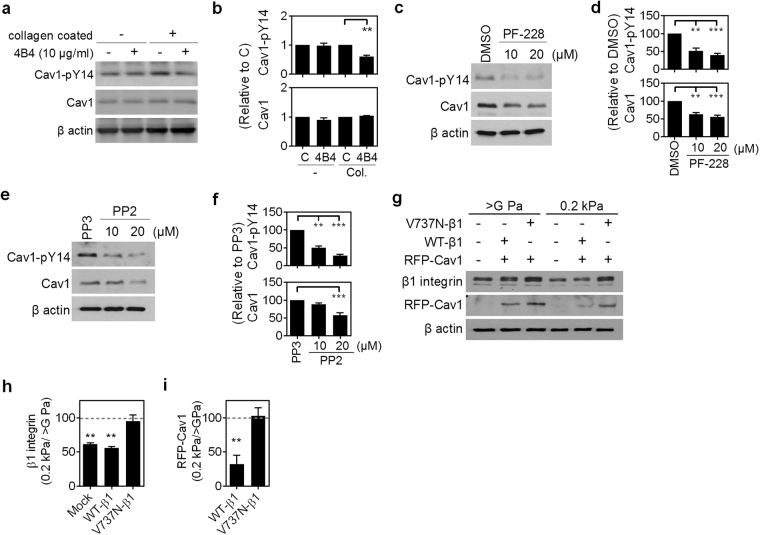
Integrin β1-mediated adhesion signal through FAK/Src activity controls the protein and phosphorylation levels of caveolin-1. (a) NMuMG cells were pretreated with or without the β1 integrin blocking antibody, 4B4, for 30 min. Cell were then replated on tissue culture plastics with or without collagen coating with the continuous treatment of blocking antibody for another 4 h. The protein and phosphorylation levels of Cav1 were assessed by western blot. Also see Supplementary Fig. S7. (b) Quantitation of results of Cav1 and Cav1-pY14 were from (a) and two other experiments. β-actin-normalized data in each condition was compared with those of cells without 4B4 treatment (C). (c) Representative western blot analysis results of NMuMG cells grown on tissue culture plastic treated with DMSO or indicated concentrations of PF-228 (μM) for 4 h. The protein and phosphorylation levels of caveolin-1 were analyzed. Also see Supplementary Fig. S7. (d) Quantitation of results of Cav1 and Cav1-pY14 were from (c) and two other experiments. β-actin-normalized data in each condition was compared with those of cells treated DMSO. (e) Representative western blot analysis results of NMuMG cells grown on tissue culture plastic treated with PP3 or indicated concentrations of PP2 (μM) for 4 h. The protein and phosphorylation levels of caveolin-1 were analyzed. Also see Supplementary Fig. S7. (f) Quantitative results of Cav1 and Cav1-pY14 were from (e) and two other experiments. β-actin-normalized data in each condition was compared with those of cells treated PP3. (g) Representative western blot analysis results of HEK293T cells grown on dishes (>G Pa) or 0.2 kPa PA gel for 4 h. HEK293T cells were cotransfected with wild-type β1 integrin (WT-β1) or auto-clustering β1 integrin (V737N-β1) and with or without wild-type Cav1 (Cav1). The protein levels of β1 integrin and Cav1 were analyzed. Also see Supplementary Fig. S7. Quantitative results of β1 integrin (h), or exogenous Cav1 (i) were from (g) and two other experiments. β-actin-normalized data in each condition was compared with those of cells grown on dishes (>G Pa). All data are expressed as relative mean ± SEM from three independent experiments. *p < 0.05; **p < 0.01; ***p < 0.001.

