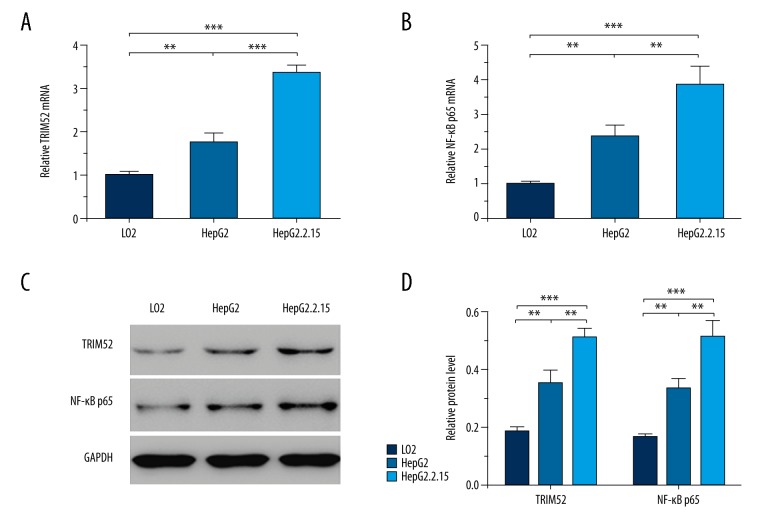
Figure 3.
TRIM52 and NF-κB p65 were up-regulated in HepG2.2.15 cells. TRIM52 and NF-κB p65 expression was detected by qRT-PCR and Western blot analysis in LO2, HepG2, and HepG2.2.15 cells. (A) The relative TRIM52 mRNA levels. (B) The relative NF-κB p65 mRNA levels. (C) The representative Western blot results of TRIM52 and NF-κB p65 expression. GAPDH was used as the loading control. (D) Statistical analysis of the relative protein levels of TRIM52 and NF-κB p65. Data are presented as mean ±SD. ** P<0.01, *** P<0.001.

