
Figure 4.
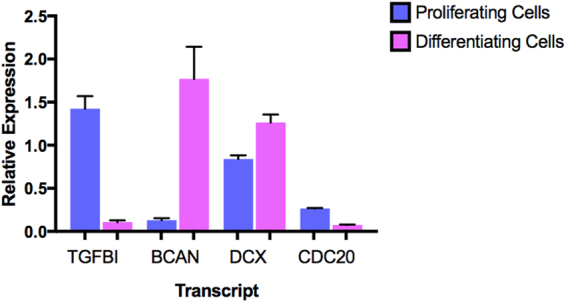
This figure shows results from our qPCR validation experiments. The bar chart shows the mean relative expression of each gene in proliferating (blue; n = 8) and differentiating (pink; n = 8) human hippocampal progenitor cells. The error bars represent the standard error of the mean. All transcripts showed significant differences between proliferating and differentiating cell populations (p < 0.005). Note: Expression of DCX and CDC20 have been multiplied by a factor of 4 to increase visibility.