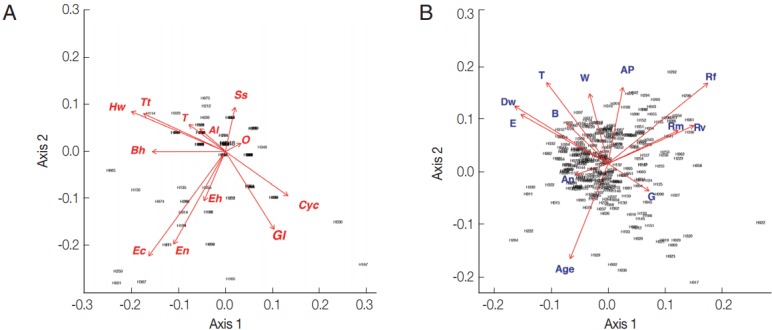
Fig. 2.

Biplot graphs show distribution of intestinal parasites in Bann Lak Sip villagers and their socioeconomic/attitudes (A) Principal Component Analyses of parasites and their distribution amongst the village inhabitants (the 2 first axes explaining 24% of the variance). (B) Principal Component Analyses of the socioeconomic/attitudes of villagers and their distribution amongst the inhabitants (the 2 first axes explaining 29% of the variance). Al, Ascaris lumbricoides; Hw, Hookworms; O, Opisthorchis sp.; Ss, Strongyloides stercoralis; T, Taenia sp.; Tt, Trichuris trichiura; Bh, Blastocystis hominis; Cyc, Cyclospora spp.; Ec, Entamoeba coli; Eh, Entamoeba hystolytica/E. dispar; En, Endolimax nana; Gl, Giardia lamblia; An, presence of domestic animals; AP, use of anti-parasitic drug; B, use of boots; Dw, type of drinking water; G, gender; E, level of education; Rf, consumption of raw fish; Rm, consumption of raw meat; Rv, consumption of raw vegetable; T, presence of toilet; W, origin of water for consumption.
