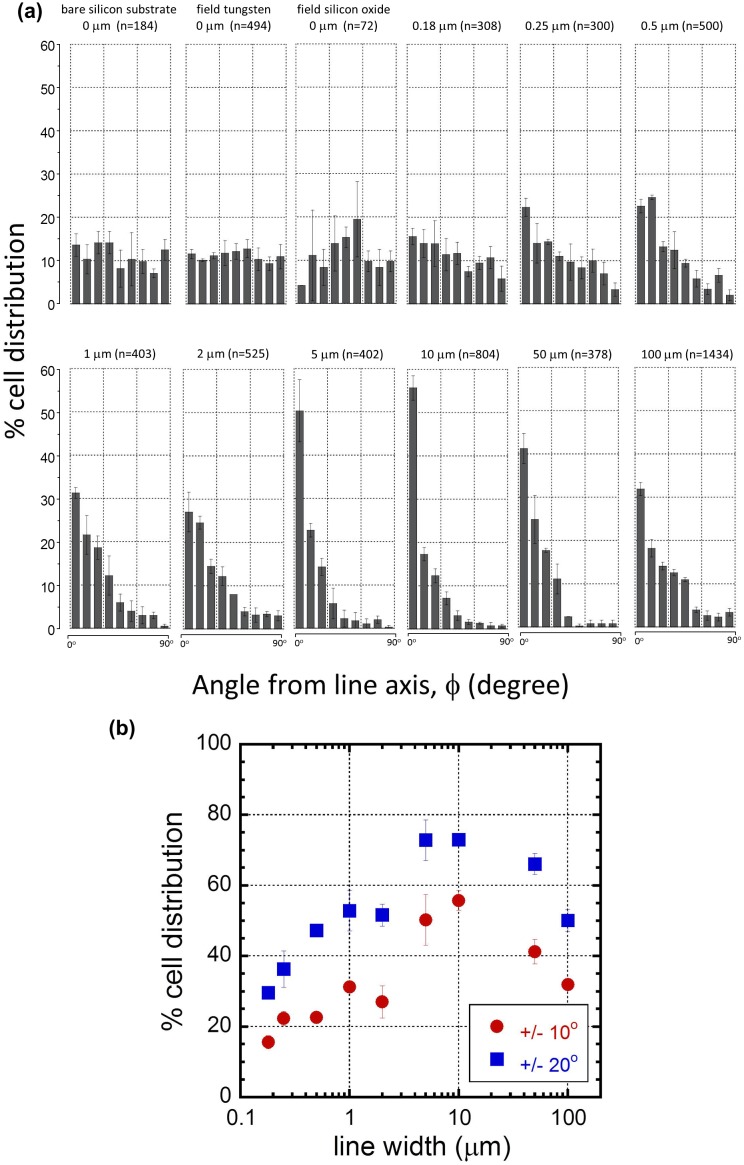
Figure 9.
(a) Plots of percent cell distribution as a function of the angle between the nuclei long axis and the metal line axis. They include results from bare silicon substrate, polished field tungsten, polished field silicon oxide, and comb structures with line widths in the range of 0.18 μm to 100 μm. The number of cells inspected in each comb structures (n) is included in each chart. Each bar represents a 10° bin of deviations from the line axis (either +/−), i.e. a cell with a nucleus major axis of −24o would be counted in the second bin from the left in each plot. Error bars correspond to one standard deviation of three independent cell populations. The initial cell concentration of the culture media was 2 ×10⁵ cells/mL. (b) Plot of cell orientation distributions as a function line width.

