
Figure 2. Analysis of the shared OTUs in different libraries.
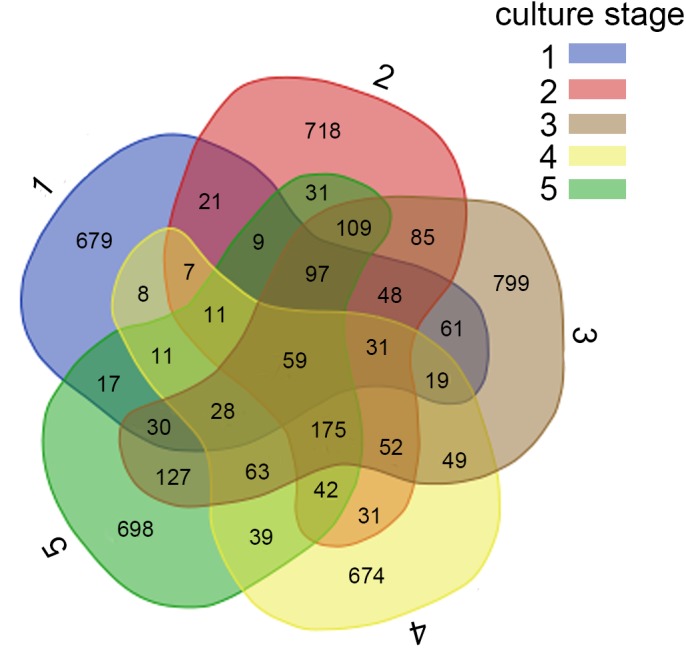
Venn diagram shows the unique and shared OTUs in the different libraries. A, B, C, D and E stand for the ponds. 1, 2, 3, 4 and 5 stand for the culture stages.
Official websites use .gov
A
.gov website belongs to an official
government organization in the United States.
Secure .gov websites use HTTPS
A lock (
) or https:// means you've safely
connected to the .gov website. Share sensitive
information only on official, secure websites.
Venn diagram shows the unique and shared OTUs in the different libraries. A, B, C, D and E stand for the ponds. 1, 2, 3, 4 and 5 stand for the culture stages.