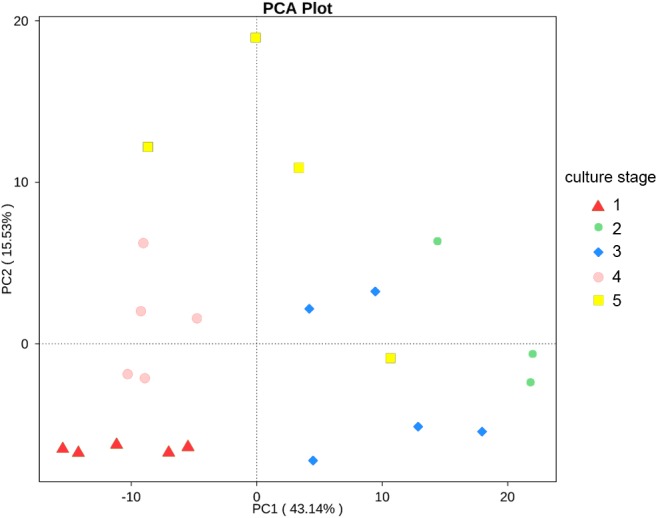
Figure 7. PCA shows the similarity of samples.

PCA presents the similarity of KOs at different culture stages. Samples from the same culture stage were clustered closer.

PCA presents the similarity of KOs at different culture stages. Samples from the same culture stage were clustered closer.