Fig. 10.

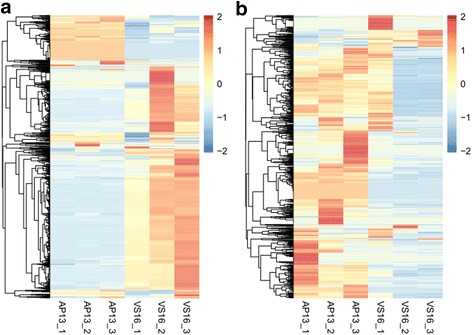
Heat map of MeDIP-Seq signals for hypermethylated-DMRs (a) and hypomethylated-DMRs (b). The color key for indicates the density of peak numbers in each sample, not the methylation levels

Heat map of MeDIP-Seq signals for hypermethylated-DMRs (a) and hypomethylated-DMRs (b). The color key for indicates the density of peak numbers in each sample, not the methylation levels