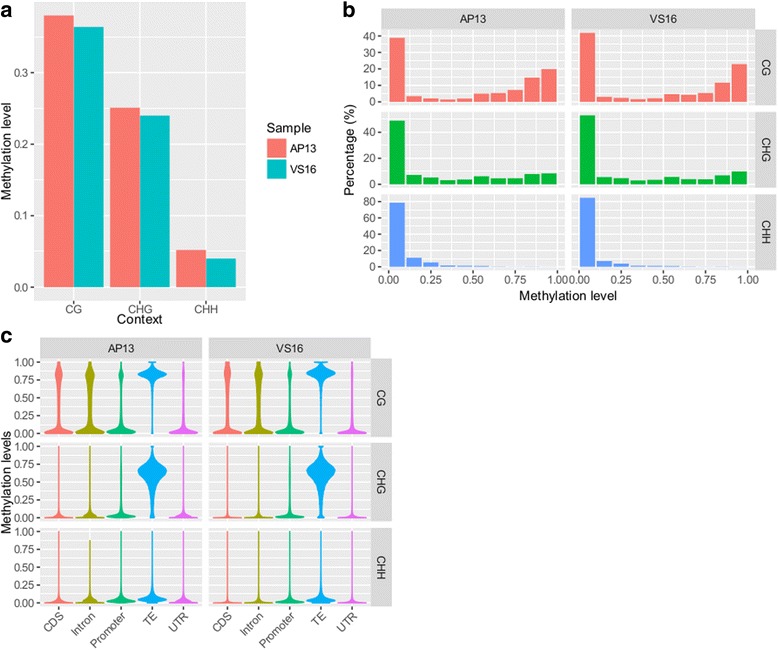
Fig. 2.

Global methylation levels, distribution, and across genomic features for CG, CHG and CHH contexts. a Methylation levels are shown for AP13 and VS16, derived from BS-seq data. b Percentages are shown for AP13 and VS16, derived from BS-seq data. c Violin plot of methylation level in different features
