Fig. 3.

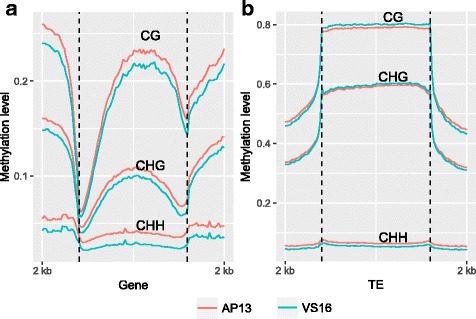
Meta-plots of DNA methylation level across genes and TEs. AP13 and VS16 methylation levels are shown for 2 kb upstream and downstream regions, as well as a) in the gene body and b) in the TE body

Meta-plots of DNA methylation level across genes and TEs. AP13 and VS16 methylation levels are shown for 2 kb upstream and downstream regions, as well as a) in the gene body and b) in the TE body