Fig. 3.

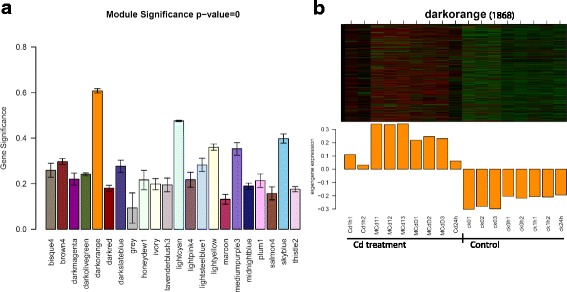
Gene co-expression network analysis of 17 RNAseq datasets for rice roots exposed to diverse concentrations of Cd for extended treatment periods. a Barplot of module significance. b Eigengene expression profile for the Cd-coupled module in 17 RNAseq samples. The module significance is defined as the mean gene significance across all genes in the module. For the heatmap of the expression of eigengenes in the Cd-coupled module (rows) across 17 RNAseq samples (see Methods section), low values means a lot of module genes are under-expressed (green color in the heatmap) and high values for over-expressed (red in the heatmap) in this samples. The number of genes in the module is indicated in parenthesis
