
Fig. 6.
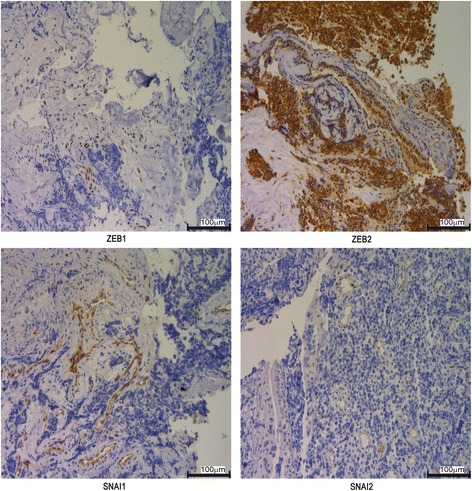
Expressions of ZEB1, ZEB2, SNAI1 and SNAI2 were analysed by IHC in SCLC tissue samples. ZEB1, ZEB2, SNAI1 and SNAI2 were detected in 60 SCLC tissue samples by IHC. Representative image was presented, and the magnification is 200 X
Official websites use .gov
A
.gov website belongs to an official
government organization in the United States.
Secure .gov websites use HTTPS
A lock (
) or https:// means you've safely
connected to the .gov website. Share sensitive
information only on official, secure websites.
Expressions of ZEB1, ZEB2, SNAI1 and SNAI2 were analysed by IHC in SCLC tissue samples. ZEB1, ZEB2, SNAI1 and SNAI2 were detected in 60 SCLC tissue samples by IHC. Representative image was presented, and the magnification is 200 X