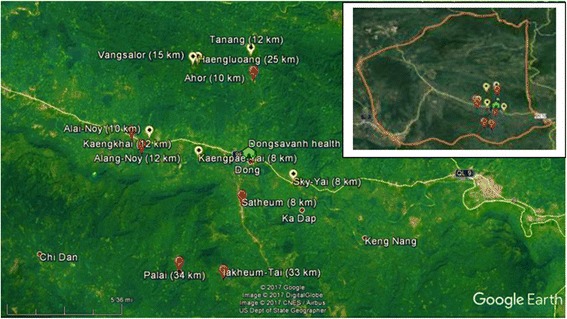
Fig. 2.

Map of the study villages. The maps show the villages in which the present study was conducted. The red points indicate the locations of case villages, and the yellow points indicate the locations of control villages along with the distance of each from Xepon district hospital according to the hospital’s data
