
Figure 4.
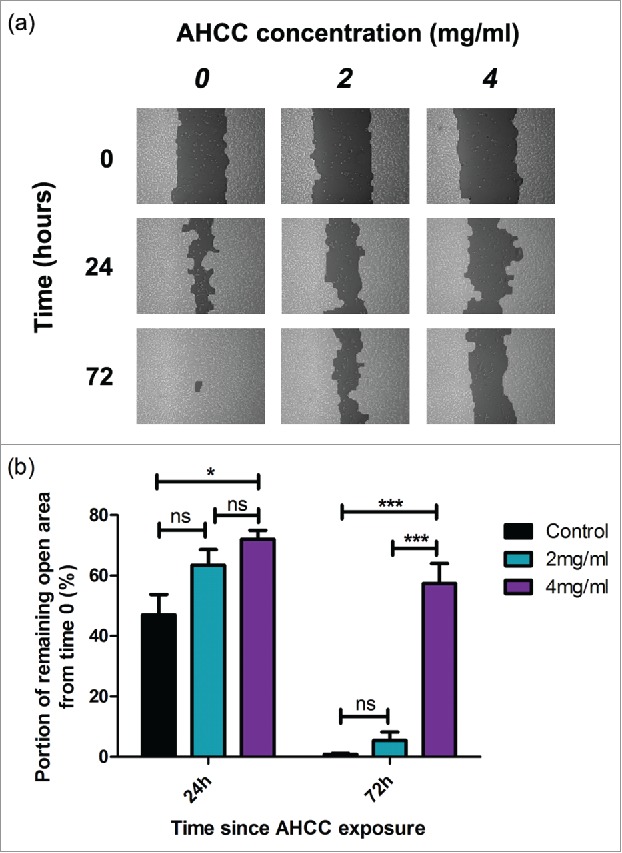
a-b. The influence of AHCC on MDA-MB-231 cell motility. (a) Photographs from TScratch program for one sample over a period of 72 hours. (b) Combined data from 3 experiments. Data are presented as mean ± SEM. Significance is represented by * for p < 0.05 and *** for p < 0.001 and non-significance by ns by Tukey's post-hoc test. Cells were grown to 90–100% confluence in a 6 well plate and scratched with a pipette tip down the middle of the well. Photos were taken on a light microscope.