
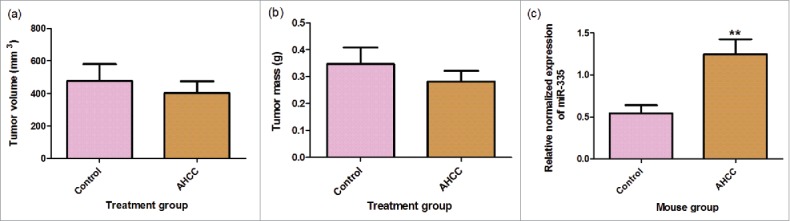
Figure 8. a-c. Mouse tumor measurements and miR-335 expression. (a) Mouse inner tumor volume. (b) Mouse tumor mass. Data are presented as mean ± SEM. Tumor volume was calculated by the equation 0.5xd2xD where d is the smaller measured diameter and D is the larger measured diameter. Mice were gavaged for 2 weeks, injected with 4T1 cancer cells, and gavaged again for 18–23 days following injection. Tumors were extracted from mice following gavage period. The means were calculated with eleven treatment mice and nine control mice. (c) Change in miR-335 expression in mice gavaged with AHCC.Mice were gavaged with 1g/kg/day AHCC in 1% sucrose water or with 1% sucrose water (control). After 2 weeks of gavage, mice were injected with 4T1 cells and sacrificed 18–21 days following. Tumors were minced and digested for RT-qPCR analysis. Data are presented as mean ± SEM. These are the results of two RT-qPCR runs with a total of 8 mice in the control group and 9 mice in the AHCC group. Quartile outliers were removed and ** indicates a significance of p-value < 0.01 by Tukey's post-hoc test.