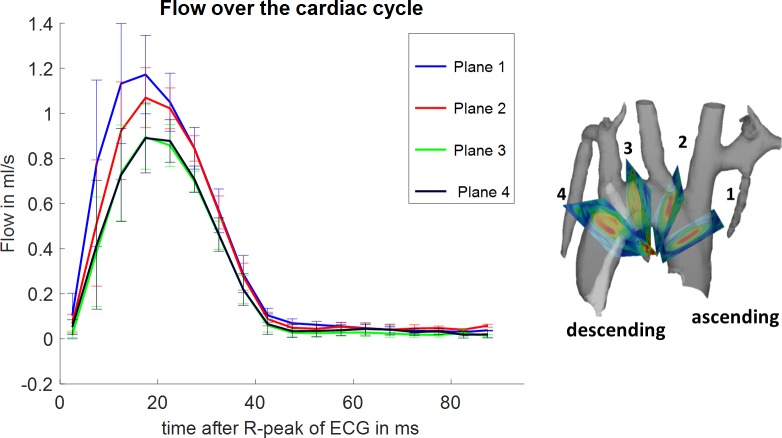
Fig 2. Mean flow over the cardiac cycle.
Flow over the cardiac cycle for four evaluation planes placed at specified locations is shown on the right. Flow is highest in the ascending aorta (AAo). The curves show the mean value of all subjects and their standard error of the mean as error bars. One can observe a trend towards lower flow velocities (plane 1 towards plane 4) as expected and longer time to peak flow durations.

