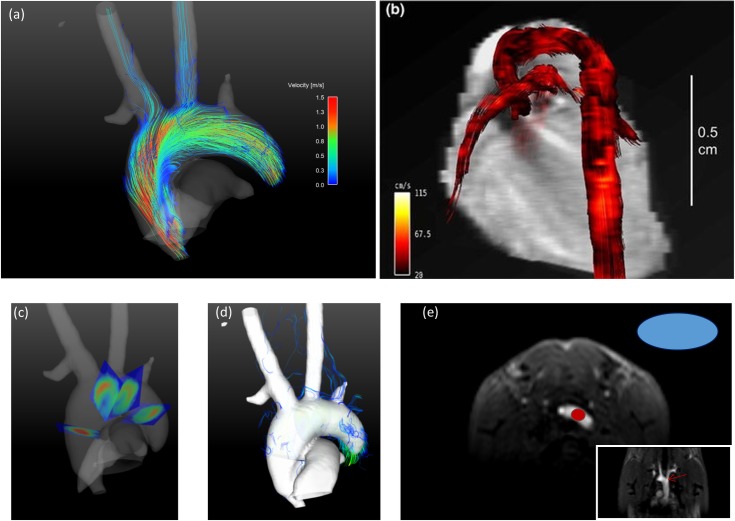
Fig 4. Streamline representation of the blood velocities during systole.
a) Streamline representation of the velocities of one mouse during peak systole. Streamlines are generated from four emitter planes placed perpendicular to the aorta as shown in (c). Streamlines are color coded with the magnitude of the velocity as displayed in the color bar. The isosurface in this image was calculated as speed-sum-of-squares isosurface from the velocity data. One can identify regions of high velocities and low velocities. The vessel lumen is equally filled. Streamlines continue even in the small branches of the aorta. Velocities are lower in the aortic branches than in the aortic root. Supplementary animation S2 Fig provides extended streamline visualization from multiple viewing angles. b) Streamline representation of the velocities of one mouse during peak systole from Bovenkamp et al [5] figure 6 (clipped). “Blood flow visualization with vector magnitude-encoded streamlines in the cardiovascular system of a mouse at 13.76 ms after R wave of the ECG”. c)Visualization of the used emitter planes for the streamlines in the aortic arch. d)Unmasked streamlines are shown that leave the isosurface. The isosurface is shown opaque in order to easily identify aberrant streamlines. e)Placement of the ROIs for SNR analysis.

