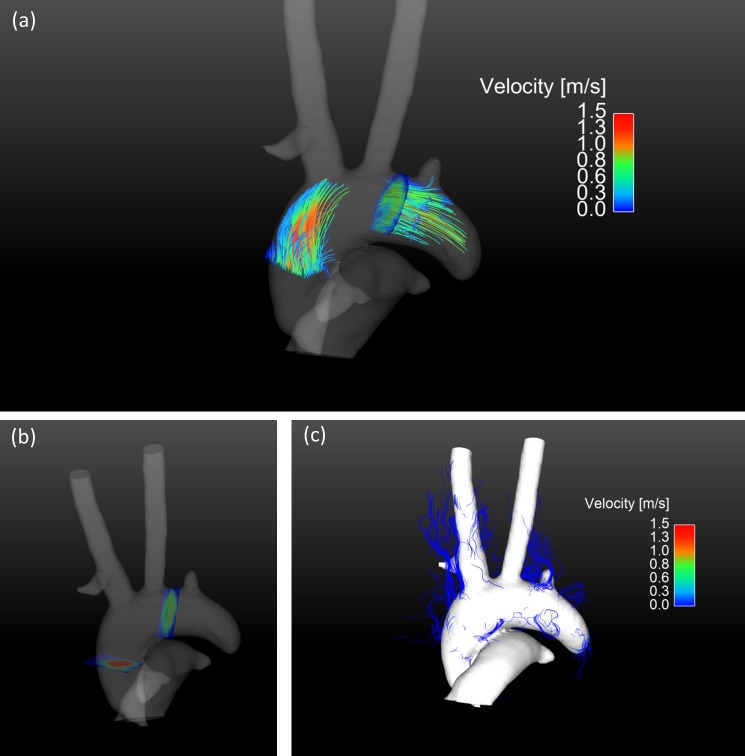
Fig 5. Pathline visualization of the blood flow in the aorta during systole.
a) Pathline visualization during systole generated in early systole from two emitter planes perpendicular to the vessel. The emitted pathlines continue into the brachiocephalic trunk, left common carotid artery and the left subclavian artery. The pathlines are masked by a speed-sum-of-squares isosurface. A pathline animation over the cardiac cycle is shown in the supplementary animation S3 Fig. b) Visualization of the used emitter planes for the pathlines in the aortic arch. c) Unmasked pathlines are shown that leave the isosurface. The isosurface is shown opaque to easily identify aberrant pathlines.

