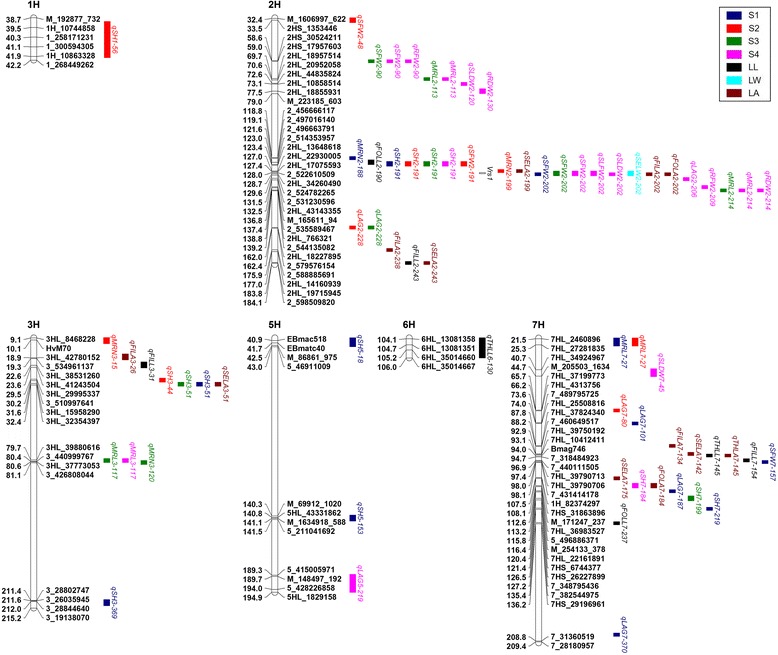
Fig. 2.

Chromosome locations of QTLs associated with 17 seedling characteristics detected in the Huaai 11 × Huadamai 6 DH population. QTL bars represented the 1.5-LOD support intervals from ICIM mapping. Genetic distance in centimorgans (cM) was placed at left. The row type trait was shown on linkage map (unfilled bars). Trait abbreviations refer to Table 6. S1 to S4 represented the 13th, 20th, 27th and 34th day after germination, respectively
