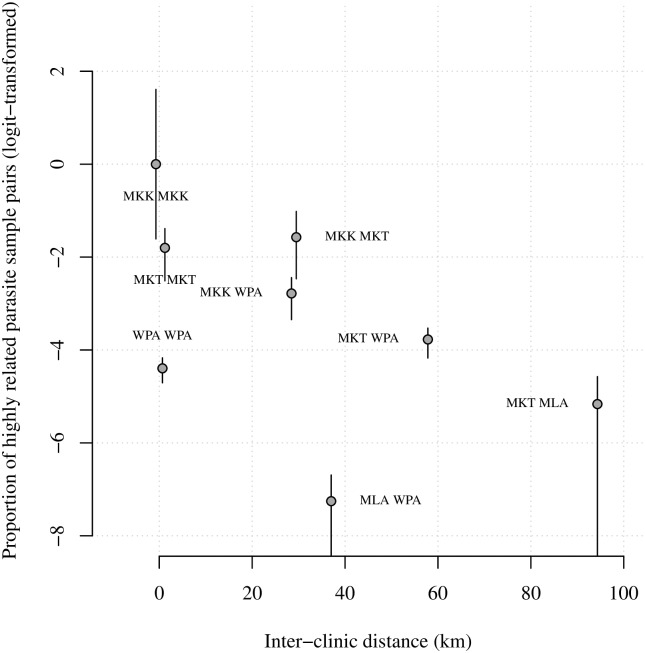
Fig 5. Logit-transformed proportions of highly related 2001–2014 WGS parasite sample pairs plotted with respect to inter-clinic distance.
Annotations refer to site comparisons using abbreviated clinic names (MLA for Maela, 55 parasite samples; WPA for Wang Pha, 103 parasite samples; MKK for Mae Kon Ken, 4 parasite samples; and MKT for Mawker Thai, 16 parasite samples). All parasite samples were single-infection. For inter-clinic pair A and B say, the proportion was based on nA × nB parasite sample pairs, where n denotes the number of parasite samples per clinic. Error bars represent 95% confidence intervals based on bootstrapping over highly related parasite sample pair labels (equal to 1 if and 0 otherwise), and are therefore zero where there are no .

