
Fig. 3.
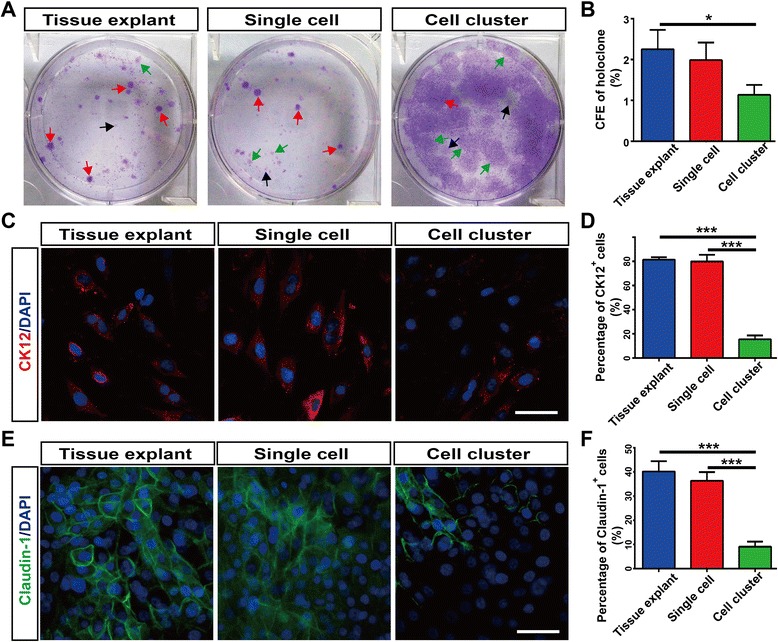
Colony forming efficiency (CFE) and corneal epithelial cell marker expression from the three cultures. a, b Crystal violet staining of LESC colonies from the three cultures. Red arrows point to holoclones. Green arrows point to meroclones. Black arrows point to paraclones. CFE of holoclones from the three cultures were quantified. c, d Corneal epithelial differentiation marker CK12 staining of the three cultures. Percentage of CK12+ cells were quantified. e, f Corneal epithelial tight junction protein Claudin-1 staining of the three cultures. Percentage of Claudin-1+ cells were quantified. Data were shown as mean ± SD from three independent experiments. One-way ANOVA analysis: *P < 0.05; ***P < 0.001. Scale bar, 50 μm. CK12 cytokeratin12, DAPI 4′,6-diamidino-2-phenylindole