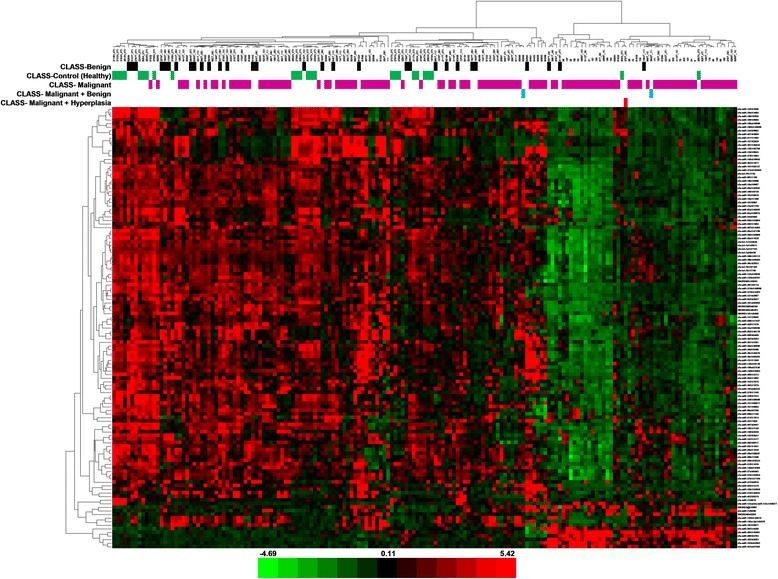
Fig. 3.

Heat map − tumour type. The scaled expression of the differentially expressed microRNAs for 171 samples and the relationship among the samples in terms of microRNAs found to be differentially expressed for the tumour type factor; Significance Analysis of Microarrays (SAM) test; the colour scale illustrates the relative expression level of a microRNA across all samples: green colour represents an expression level below the mean and red colour represents an expression level above the mean. The most distinct differences in microRNA profile are between the control and malignant group − microRNAs mostly down-regulated in the malignant group
