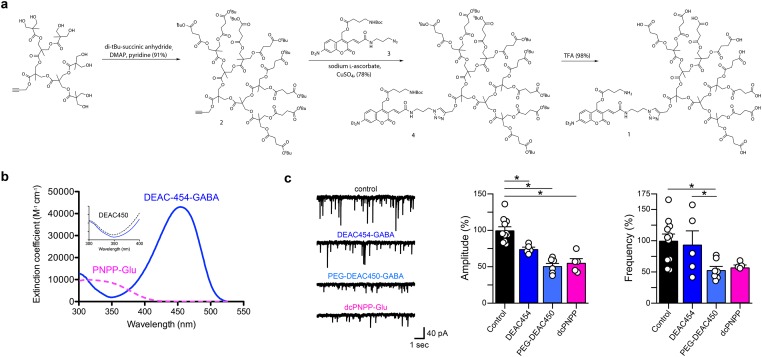
Fig 1. Synthesis, pharmacology and absorption spectrum of DEAC454-GABA.
(a) Synthetic scheme for DEAC454-GABA (1). (b) Absolute absorption spectra of DEAC454-GABA (blue lines) and dcPNPP-Glu (violet dashed). Inset: normalized absorption spectra of DEAC454-GABA and PEG-DEAC450-GABA (black dashed) showing their relative minima in the near-UV. (c) Left, representative recordings of mIPSCs from hippocampal CA1 neurons under control conditions and in the presence of 28–31 μM DEAC454-GABA, 29–31 μM PEG-DEAC450-GABA or 290 μM dcPNPP-Glu. Right, summaries of the relative effects of DEAC454-GABA (n = 5 cells), PEG-DEAC450-GABA (n = 7 cells) and dcPNPP-Glu (n = 5 cells) on mIPSC amplitude and frequency compared to control recordings (n = 11 cells). For each cell, >200 events were analyzed. All compounds significantly reduced the amplitude while the frequency was only affected by PEG-DEAC450-GABA (* p < 0.05; One-Way ANOVA with post-hoc Tukey test). Recordings were made in the presence of TTX (1 μM), AMPA (CNQX, 10 μM) and NMDA receptor (DL-AP5, 100 μM) antagonists.

