
Figure 6.
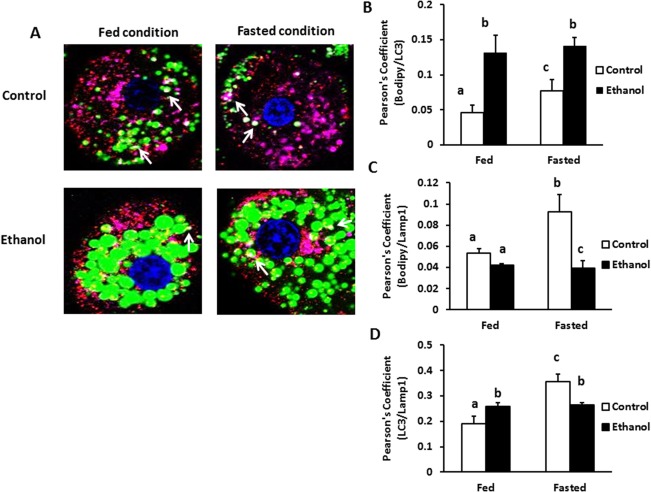
EtOH administration decreased colocalization of lysosomes with autophagosomes and LDs. Hepatocytes from control and EtOH‐fed animals were treated with either fed or fasting media for 4 hours and stained for colocalization of LDs (BODIPY stain, green) with LC3 (red) and LAMP1 (pink) proteins. (A) Images show colocalization of LC3 and Lamp1 on the LDs surface, as indicated by the white regions in the images. Colocalization was performed by ImageJ and calculating the Pearson's overlap coefficient, corresponding to the fraction of green pixels that overlap with red or pink pixels. (B) Overlap coefficient for LC3 and BODIPY in fed and fasted conditions. (C) Overlap coefficient for LAMP1 and BODIPY in fed and fasted conditions. (D) Overlap coefficient for LC3 and LAMP1 in fed and fasted conditions. Values not sharing a common letter are statistically different. Data pooled from three independent experiments are expressed as the mean ± SEM (P < 0.05).