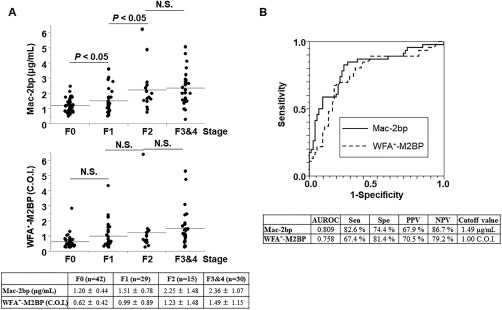
Figure 4.

Comparison of Mac‐2bp and WFA+‐M2BP as liver fibrosis prediction biomarkers. (A) Correlation between serum Mac‐2bp levels and liver fibrosis stage (upper panel). Correlation between serum WFA+‐M2BP levels and liver fibrosis stage (middle panel). The table presents the results for the mean values of Mac‐2bp and WFA+‐M2BP at each liver fibrosis stage. (B) ROC curves of Mac‐2bp and WFA+‐M2BP for the prediction of advanced liver fibrosis (≥F2) in patients with biopsy‐proven NAFLD. The table presents the results for the efficacy of each biomarker. NPV, negative predictive value; N.S., not significant; PPV, positive predictive value; Sen, sensitivity; Spe, specificity.
