Figure 3.

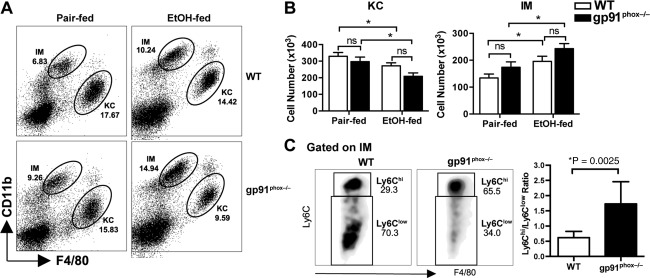
Comparison of the numbers of total hepatic MΦs and each subpopulation in WT and gp91phox −/− mice. Female WT and gp91phox−/− mice were treated as described in Fig. 1. (A) Liver NPCs from pair‐fed or EtOH‐fed WT and gp91phox−/− mice were analyzed by flow cytometry. KCs and IMs are distinguished by differential CD11b and F4/80 expression. Dot plots shown are representative of eight mice per group from two independent experiments. (B) The absolute numbers of KCs and IMs were calculated from eight mice per group. (C) The proportions of Ly6Chi IMs and Ly6Clow IMs among total IMs are compared between EtOH‐fed WT and gp91phox−/− mice (eight mice per group). *P < 0.05 compared to WT mice. Abbreviation: n.s., not significant. Error bars in the histograms stand for SEM.
