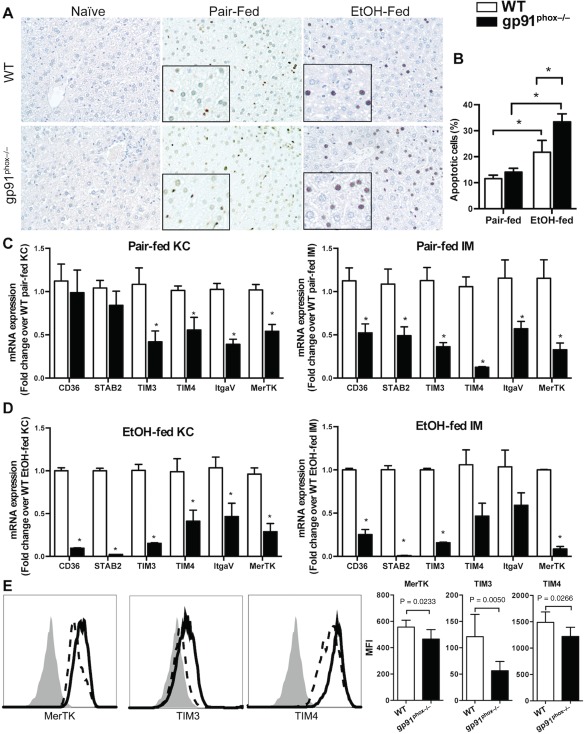
Figure 5.

Increased apoptotic cell accumulation in the liver of EtOH‐fed gp91phox−/− mice and reduced efferocytic receptor expression in gp91phox−/− MΦs. (A,B) Naive, pair‐fed, and EtOH‐fed WT and gp91phox−/− mice were killed after 4 weeks of treatments. Apoptotic cells were visualized by TUNEL staining and quantified with ImageJ (magnification ×200, magnification of the inset ×400). *P < 0.05. Data shown are from six mice per group. (C,D) Liver KCs and IMs were purified from pair‐fed and EtOH‐fed WT and gp91phox−/− mice. The mRNA expression levels of various efferocytic receptors were measured. *P < 0.05 compared with WT mice. Data shown are from 12 mice per group in three independent experiments. (E) Comparison of protein levels of the receptors expressed on MΦs. In the graphs, solid line indicates EtOH‐fed WT MΦs, dash line indicates gp91phox−/− MΦs, and isotype controls are shown as solid gray histograms. MFI values are shown. *P < 0.05 compared with WT mice. Data shown are from seven mice per group. Abbreviations: ItgaV, integrin alpha V; MFI, mean fluorescence intensity; STAB2, stabilin 2; TUNEL, terminal deoxynucleotidyl transferase‐mediated deoxyuridine triphosphate nick‐end labeling. Error bars in the histograms stand for SEM.
