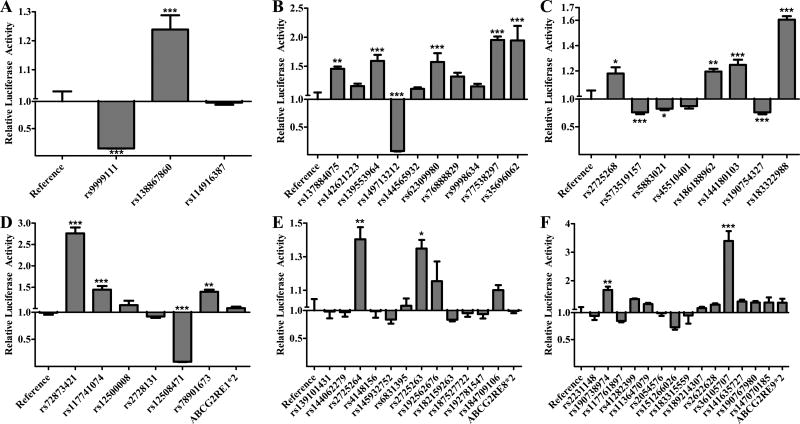
Figure 1. Effect of Enhancer Variants in HepG2 Cells.
The luciferase activity of reference and variant A) ABCG2RE14, B) ABCG2RE26, C) ABCG2RE6, D) ABCG2RE1, E) ABCG2RE8 and F) ABCG2RE9 enhancer regions were measured in a transiently transfected liver cell line. Enhancer activity is expressed as the ratio of firefly to Renilla luciferase activity normalized to the reference vector activity (reference is set to 1). SNPs are displayed respective to their genomic orientation. Data is expressed as the mean ± SEM from a representative experiment with 3–6 wells per sequence. Differences between reference and variant enhancers were tested by an ANOVA followed by a post-hoc Bonferroni’s multiple comparison t-test; * P < 0.05, ** P < 0.001, *** P < 0.0001.

