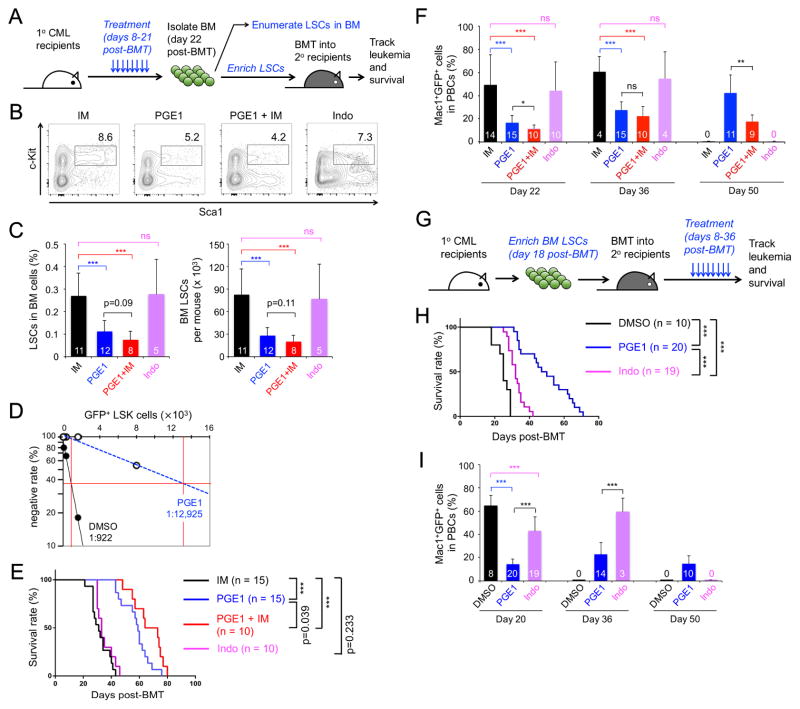
Figure 3. PGE1 impairs LSC activity.
A–F. Impact of PGE1 on primary LSCs.
A. Experimental design. CML was established in 1° recipients, followed by a 2-week treatment with imatinib (IM), PGE1, PGE1+IM, or indomethacin (Indo) and downstream analyses.
B. Detection of Sca1+c-Kit+ cells in Lin−GFP+ BM cells.
C. Cumulative data on frequency of LSCs (GFP+ LSK cells) in whole BM (left) and LSC numbers (right). The number of recipients is marked in the bars.
D. Detection of functional LSCs by limiting dilution assay. Graded numbers of BM cells from DMSO- or PGE1-treated 1° recipients (CD45.2+) were mixed with 2 × 10⁵ protector BM cells (CD45.1+) and transplanted into secondary (2°) recipient mice (CD45.1+). Plotted are the percentages of 2° recipients containing < 1% CD45.2+GFP+ leukemia cells in the PBCs. Also marked is the frequency of functional LSCs calculated according to Poisson statistics.
E. LSCs were enriched from the BM of treated 1° recipients and transplanted into irradiated 2° recipients, which were monitored for survival.
F. Leukemia burden in the PBCs of 2° recipients. Values (in bars) indicate numbers of starting recipients (day 22) or surviving recipients observed.
G–I. Impact of PGE1 on serially transplanted LSCs.
G. Experimental design. LSCs were enriched from untreated 1° CML mice and transplanted into irradiated 2° recipients, followed by treatment with PGE1 or indomethacin.
H. Survival curve of the treated 2° recipients.
I. Leukemia burden in PBCs of treated 2° recipients. Values (in bars) indicate numbers of starting recipients (day 20) or surviving recipients observed. Data are means ± s.d. from 2–3 independent experiments. ns, not statistically significant; ***, p<0.001 unless specified.

