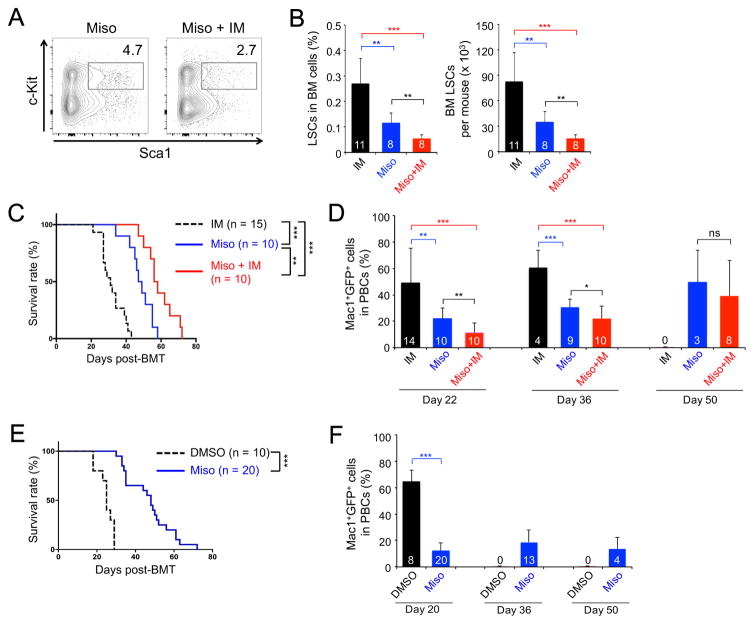
Figure 6. Misoprostol, an EP4 agonist, impairs LSC activity.
All the experiments testing misoprostol (Miso), alone or with imatinib (IM), were performed together with those testing PGE1 as in Figure 3. Thus, the data on IM group are ‘re-used’ in panels of this figure for convenience of direct comparison.
A–B. Impact of misoprostol on maintaining LSCs. The 1° CML recipients were treated with misoprostol, and BM LSCs were analyzed as in Figure 3A. A. Representative data showing the frequency of Sca1+c-Kit+ cells in Lin−GFP+ BM cells. B. Cumulative data on LSC frequency in whole BM (left) and LSC numbers (right).
C–D. Impact of misoprostol on LSCs in propagating CML in secondary recipients. LSCs were enriched from BM of misoprostol-treated 1° recipients and transplanted into 2° recipients, as in Figure 3A. C. Survival curve of the 2° recipients. D. Leukemia burden in the PBCs of 2° recipients.
E–F. Impact of misoprostol on serially transplanted LSCs. LSCs were enriched from BM of untreated 1° recipients and transplanted into 2° recipients, which were treated with misoprostol as in Figure 3G. E. Survival curve of the treated 2° recipients. F. Leukemia burden in the treated 2° recipients. Data are from 2–3 independent experiments, and values (in bars in B, D, F) mark numbers of starting recipients or surviving recipients observed. ns, not statistically significant; *, p<0.05; **, p<0.01; ***, p<0.001.

