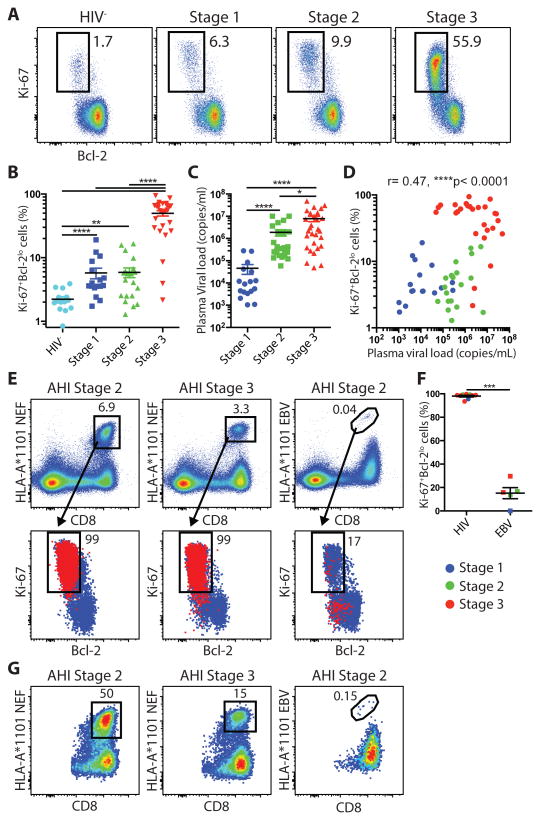
Fig. 1.
HIV-specific CD8+ T cells expansion in acute HIV-1 infection. (A) Representative dot plot of Ki-67+Bcl-2lo CD8+ T cells from AHI week 0. (B) Percentages of Ki-67+Bcl-2lo cells in CD45RA-CD8+ T cells from 14 HIV- and 16 AHI 4thG Stages 1, 20 Stage 2, and 27 stage 3 individuals. (C) Plasma viral load during the different stages of AHI week 0. (D) Correlation between plasma viral load and percentages of Ki-67+Bcl-2lo CD8+ T cells. (E) HLA-A*1101 NEF or EBV tetramer+ CD8+ T cells in two acutely-infected individuals gated on total live peripheral blood lymphocytes (PBLs) (Top). Overlay of Ki-67+Bcl-2lo expression on tetramer+ (Red) and total CD45RA-CD8+ T cells (Blue) from the same participants (Bottom). (F) Percentage of Ki-67+Bcl-2lo in HIV or EBV tetramer+ cells from 2 AHI stage 1, 3 stage 2, and 6 stage 3 participants. (G) HLA-A*1101 NEF or EBV tetramer+ CD8+ T cells gated on Ki-67+Bcl-2lo CD8+ T cells. Differences between groups were analyzed by Mann-Whitney tests. Associations between two variables (p and r) were analyzed by Spearman correlations.*P< 0.05; **P< 0.01; ****P< 0.0001.

